With the Consumption Plan hosting model for Azure Functions, we can take advantage of event-driven scaling to automatically spin up extra instances of a Function app based on load. In this post, we’ll cover how you can view this in real-time and also how to chart the scaled-out instances retrospectively over time.
Real-time instance monitoring
We can look at how many instances the Function App has scaled out to in real-time, by drilling through to the Live Metrics from within the Function App in the Azure Portal:
- Go to Monitoring -> Log Stream in the side menu
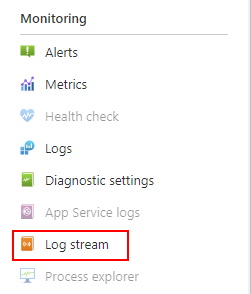
- Select “Open In Live Metrics”
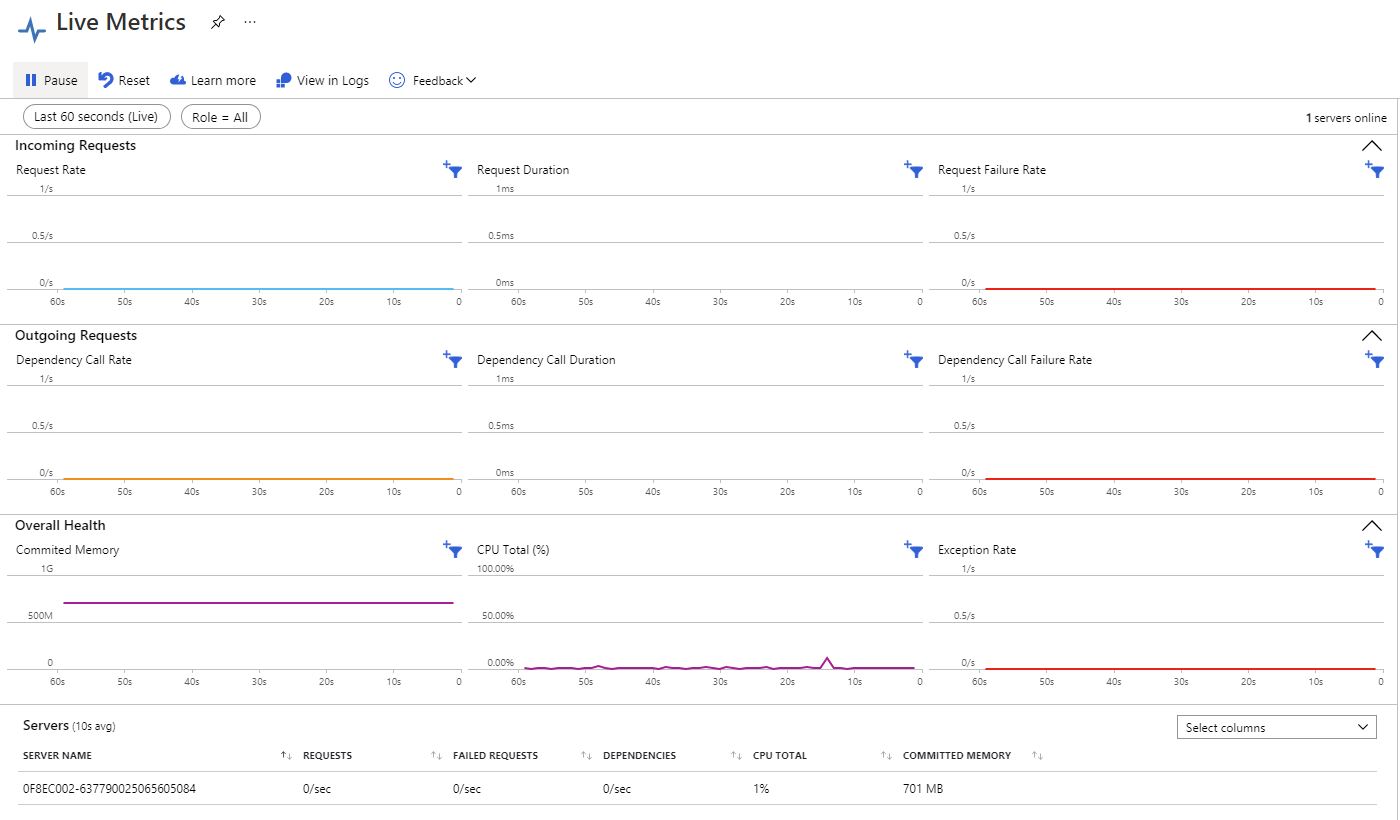
 which takes us to this view:
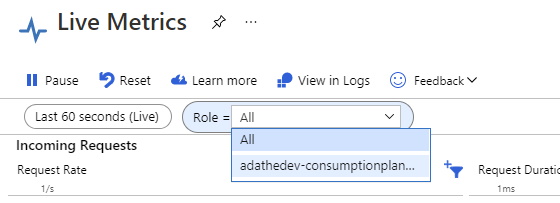
- In the Role dropdown, choose your Function App, just to make sure you’re only looking at the one you’re interested in
- The Servers section at the bottom of the view lists the instances.
We can now watch in real-time as instances of our Function App are added and removed in response to load.
This is a great view, but if we want to see some stats retrospectively - as a chart over time on a dashboard for example - it doesn’t serve that purpose.
Monitoring instance scale-out over time
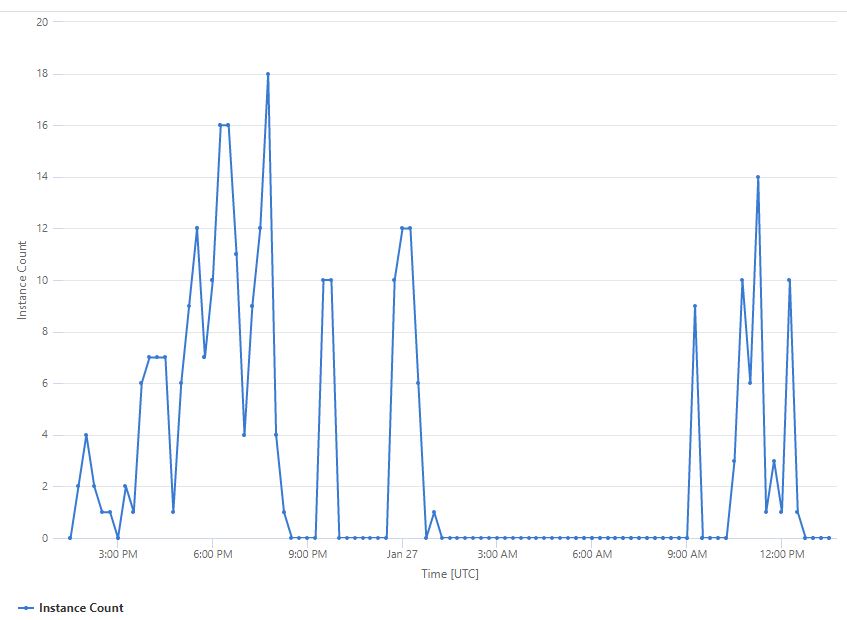
We can get the information using a custom KQL query, and plot the instance count over time. In this case, we’re going to get a count for every 15 minute window in the past 24 hours and plot that in a time chart.
Within the Function App in the Portal:
- Go to Monitoring -> Logs
- Run this query, swapping in the name of your Function App to match on
cloud_RoleName:
range _bin from bin(ago(1d), 15m) to bin(now(), 15m) step 15m
| join kind = leftouter
(
traces
| where cloud_RoleName == 'adathedev-consumptionplanmonitoring' and timestamp >= ago(1d)
| extend _bin = bin(timestamp, 15m)
| distinct cloud_RoleInstance, _bin
| summarize count() by _bin
)
 on _bin
| project Time = _bin, ["Instance Count"] = iif(count_ > 0, count_, 0)
| order by Time
| render timechart
- Profit!
And here’s the result: